
# Crie uma sequência de números de 1 a 10
seq(from = 1, to = 10)
[1] 1 2 3 4 5 6 7 8 9 10The training of researchers is essential both for the quality of empirical research and for promoting the technical and economic development of a country. Through representation and inferential analysis tools, Statistics provides a better understanding of events when there is a large amount of data, variability, and uncertainties (Estevam & Kalinke, 2013). Furthermore, the teaching of Statistics has gained more visibility due to the current market demand for professionals who can handle large amounts of information and master data analysis techniques, anticipating decision-making inferred from sample data (Vendramini & Brito, 2001).
It is also necessary that, due to this visibility, there is greater care in the technical application of data interpretation, considering the expectation of finding the truth through these instruments (Cordani, 2001). Thus, there is a need to expand the training opportunities for professionals capable of handling this demand.
The increased processing capacity of personal computers has enabled relatively complex statistical analyses to be performed by a wide range of people. In this context, several programs have emerged to facilitate such analyses. However, the most commonly used and popular applications are paid and have closed code, meaning that their source code is not open to the public, only the developers or the company owning the software rights have this knowledge. Thus, acquiring licenses is often prohibitively expensive.
In this sense, the R programming language has become popular as a versatile and powerful tool for statistical data analysis, as it is free and open-source, allowing users to view, use, and modify it according to specific license terms, promoting transparency and user collaboration for its development. Additionally, there are numerous developers creating countless packages that expand R’s analytical possibilities. An R package is a collection of functions, data, documentation, and other resources that can be installed and used in R. Packages organize and share code and data and can be used to extend R’s functionality.
Moreover, the user community interacts strongly and provides mutual support, clarifying doubts, evaluating error messages, and helping find the best path for analyses, graph construction, tables, and more. Additionally, the R Studio application provides a user-friendly graphical interface that facilitates the use of R. Together, R and R Studio enable everything from simple analyses to the construction of complex statistical models.
In this context, we need to consider the ease with which postmodern society accesses information. This allows the search for academic and professional knowledge to occur in various ways beyond traditional means. Therefore, it is pertinent to adopt tools that assist in learning Statistics, such as Information and Communication Technologies (ICTs). When used appropriately, ICTs can be powerful in this task, favoring the understanding of statistical and probabilistic concepts. ICTs provide easy and agile access to the application of learned content (Estevam & Kalinke, 2013).
In this scenario, MOOCs (Massive Open Online Courses) can be cited as an example. These are courses offered online, free of charge and openly, without the need for prerequisites. Notably, there is no participant limit, allowing for a broad audience (Dal Forno & Knoll, 2014).
The methods used in MOOCs are often fluid. Most promote interaction and aim for collaborative education. Conversely, others have a traditional approach where the teacher is the primary knowledge source and dictates the steps students will follow (Cid Bastos & Biagiotti, 2014).
MOOCs were introduced as distance education models in 2008 but only gained traction in 2012 through investments, scaling up and gaining popularity, contributing globally to higher education (Gonçalves & Gonçalves, 2014). Thus, MOOCs have at least ten years of contribution to education, offering a wide range of courses in various areas and levels of knowledge, both technical and scientific.
In this context, MOOCs can richly contribute to learning, as they are accessible and can occur alongside other forms of education, such as Higher Education courses, providing autonomy in managing completion time. Additionally, by offering self-directed learning, students can revisit topics needing more attention according to their needs. MOOCs also facilitate interaction with other students, providing experience exchange and tips, further aiding the learning process.
In 2023, a Google search reveals some Brazilian courses related to R education. The Coursera platform offers several MOOCs, including a specific one on Data Analysis with R programming at an intermediate level, provided by Google Career Certificates (Google, 2022). Another example is found on the Federal Institute of Espírito Santo’s (IFES) MOOC platform, called Statistics with R, aimed at students interested in data analysis using statistical methods with this research tool (Instituto Federal do Espírito Santo, 2024). The Federal Government’s Virtual School of Government also offers a course called Data Analysis in R Language, primarily teaching R language use for data preparation and exploration (Escola Nacional de Administração Pública, 2022).
Additionally, English MOOCs on R education are also available. Coursera offers, besides the aforementioned Portuguese course, others like “Introduction to R Programming for Data Science” by IBM (IBM, 2024) and “Data Science: Foundations using R” by Johns Hopkins University (Johns Hopkins University, 2024).
Given this, it is essential to highlight the importance of different MOOCs on the same subject because, concerning the mentioned courses, there are differences in knowledge levels and skills addressed. For instance, the Coursera platform’s course is intermediate, the government’s course is specific to its application in Statistics, and the IFES course has advanced content in Statistics but only gives basic notions of R. Moreover, courses in English can hinder access for Brazilian students not proficient in the language.
Moreover, courses have different pedagogical approaches that can suit students differently, positively or negatively, especially when MOOCs cater to a broad audience with pre-established knowledge and specific needs. Thus, a variety of courses enhances these individuals’ choice of what and how they prefer to study.
Another important factor is that, in the case of the R language, being open-source, it is constantly evolving. This can make courses obsolete, requiring content updates.
This report presents the MOOC “Introduction to R for data analysis in Psychology,” aiming to help researchers and students transition from proprietary software and/or graphical interfaces to a free, flexible programming language.
This proposal differs from other R courses in Brazil and other countries because, despite their excellence, the learning is directed towards Data Science or Statistics. Thus, the content and its presentation are more complex and diverge from the routine tasks required by Psychology or Humanities and Social Sciences researchers.
The goal is not to exhaust R’s possibilities as a programming language but to adapt them to the needs of the mentioned areas. Additionally, the intention is for this language to be learned intuitively. Coding with R’s basic functions is very powerful and can implement advanced solutions, but it does not seem to have been created to adapt to everyday language.
At this point, using a set of packages called tidyverse (Wickham et al., 2019) brings coding closer to natural language, making it readable by both computers and humans, known as literate programming. Verbs, adverbs, nouns, and pronouns facilitate understanding where one starts and intends to go with the used functions. Here, there is a small drawback: all functions are in English, so some knowledge of the language facilitates learning. Thus, this MOOC might be better characterized as a workshop on R through tidyverse.
Furthermore, an initial formation generates the possibility of using courses that require prior knowledge, like those previously mentioned. Therefore
, the course aims to develop technical skills for data analysis in the Humanities, using R. Moreover, it intends to add critical knowledge that aids in data interpretation.
The course formulation followed these stages: needs analysis (presented in the introduction), planning, implementation, and execution (Fassbinder et al., 2014). Clarifying these points is essential to understand how the MOOC will be conducted and executed and the process by which it was built.
The planning phase involves structuring the MOOC. It includes how the content will be presented, the development team, the linked platform, and the costs or profits of the course. Following this logic, it was decided to use recorded video lessons presented by Professor Dr. Francisco Pablo Huascar Aragão Pinheiro for content presentation. As will be seen later, during this report’s elaboration, the course was conducted in a pilot format with live classes via Google Meet that were recorded. Thus, the decision on the platform through which the course will be available will be made later.
The project development team is linked to the Laboratory of Practices and Research in Psychology and Education (LAPPSIE) at the Federal University of Ceará (UFC) Sobral campus. A group within this laboratory has dedicated itself to producing quantitative research in Work Psychology, such as “Student health in a public university: a study in the Brazilian northeast” (Vieira et al., 2022), “Prevalence and predictors of common mental disorders among university professors in the interior of Ceará” (Vieira et al., 2023), and “Characteristics of violence against public school teachers” (Pinheiro et al., 2020). LAPPSIE is also committed to teaching quantitative research techniques, especially in Psychology, such as the course presented here.
The MOOC is not intended for profit and will be made available free of charge, as UFC’s mission is to disseminate knowledge within and outside the university, adhering to the inseparable principle of teaching, research, and extension. These three pillars connect to contribute significantly to building a free, just, and supportive society.
During the implementation, the didactic material on which the course will be based is evaluated, and activities are created and developed. The presented workshop currently bases itself on the books “R for Data Science” (Wickham & Grolemund, 2023) and “Statistical inference via data science: A ModernDive into R and the tidyverse” (Ismay & Kim, 2022). The first is popular among data scientists and others who want to learn to use the R programming language. It is known for using the “tidy data” approach, which allows organizing data to facilitate its manipulation and visualization. The second presents practical concepts and computational methods and uses the R language and the tidyverse package set for data analysis.
Sets of slides, exercise blocks, and their respective solutions were developed, all made available on a page initially built to host the course content https://fphap.quarto.pub/rpsi/. These materials were developed using R coding through the Quarto tool, a markup language that creates dynamic documents, reproducible reports, and more. It can also be used to create educational materials like interactive tutorials, exercises, slide presentations, and books (like the one you’re reading).
So far, six modules have been developed for the workshop, and a module on regression is under construction. Discussions on descriptive statistics and more basic analyses such as correlation, t-test, ANOVA, and chi-square will be added soon. The following presents the already elaborated modules and a sample of what is learned in each.
This module introduces the minimum necessary to familiarize oneself with R’s basic language (R Core Team, 2022). When dealing with basic coding, there is not always a transposition of what is done in software with a graphical interface, but this initial step is essential to understand how R works by itself.
Exemplo: função seq()
The first two arguments of the seq function are from and to
# Crie uma sequência de números de 1 a 10
seq(from = 1, to = 10) [1] 1 2 3 4 5 6 7 8 9 10Third argument: by
# Agora, o incremento da sequência é por 2
seq(from = 1, to = 10, by = 2)
[1] 1 3 5 7 9If the argument values are in the function order, you can omit them
seq(1,10,2)[1] 1 3 5 7 9Use the rnorm function and create an object called hundred with 100 cases, mean of 30, and standard deviation of 4. You can see the function arguments with ?rnorm.1
Before analyzing the collected data, some essential tasks are necessary, such as creating variables from those initially collected, filtering values, and arranging them in ascending or descending order. It may also be necessary to select, rename, and reposition variables. Summarizing some results is also important in this data manipulation phase. All these tasks can be done with the dplyr package (Wickham, François, et al., 2023). Learning how dplyr works will be the main goal of this module.
The ufo_sightings.csv dataset will be used. This data provides information about unidentified flying object sightings. To obtain the data, run the following code:
ufo <- read_csv("./data/ufo_sightings.csv")Rows: 96429 Columns: 12
── Column specification ────────────────────────────────────────────────────────
Delimiter: ","
chr (7): city, state, country_code, shape, reported_duration, summary, day_...
dbl (1): duration_seconds
lgl (1): has_images
dttm (2): reported_date_time, reported_date_time_utc
date (1): posted_date
ℹ Use `spec()` to retrieve the full column specification for this data.
ℹ Specify the column types or set `show_col_types = FALSE` to quiet this message.Exercise
Sightings occur in various US states. What is the average duration (in hours) in the state with the most cigar-shaped object sightings?
ufo |>
  mutate(
    dur_horas = duration_seconds/3600
  ) |>
  filter(country_code == "US",
         shape == "cigar") |>
  group_by(state) |>
  summarise(
    n = n(),
    M = mean(dur_horas)
  ) |>
  arrange(desc(n))
# A tibble: 51 × 3
state n M
<chr> <int> <dbl>
1 CA 250 2.39
2 FL 146 1.74
3 TX 119 2.91
4 NY 109 2.63
5 WA 90 1.13
6 PA 88 2.95
7 OH 76 2.03
8 NC 72 2.42
9 IL 68 0.114
10 OR 68 0.0798
# ℹ 41 more rowsAnswer: 2.39 hours
In the tidyverse context, iteration refers to repeatedly performing the same action on different objects. It is possible, for instance, with the summarise function, to calculate the mean and standard deviation of several columns at once or transform them with the mutate function. Iteration is important as it avoids copying and pasting functions more than twice, which can propagate errors in the code. This is a very powerful tidyverse capability; however, given the workshop’s introductory nature, the focus will be on the across() function.
Creating a dummy dataset
# A tibble: 10 × 4
          a       b        c      d
      <dbl>   <dbl>    <dbl>  <dbl>
 1 -0.918   -0.113  -0.826    0.889
 2  0.967    2.25   -0.185    0.976
 3  0.398   -0.0674 -1.06    -0.879
 4  0.0252   0.808   0.471   -1.75
 5  1.29    -1.97   -1.35    -0.684
 6 -0.00722 -2.34   -0.696   -0.576
 7 -1.56     0.0282 -0.00926 -0.802
 8  1.10     0.332   1.11     1.33
 9 -1.14    -0.280  -2.12     0.948
10 1.24 0.741 -0.902 2.11 # A tibble: 1 × 4
a b c d
<dbl> <dbl> <dbl> <dbl>
1 0.212 -0.0196 -0.761 0.157Exercise
In the economics dataset, calculate the mean of the pce, pop, and psavert variables using the across function.
economics |>
  print(n = 3)
# A tibble: 574 × 6
date pce pop psavert uempmed unemploy
<date> <dbl> <dbl> <dbl> <dbl> <dbl>
1 1967-07-01 507. 198712 12.6 4.5 2944
2 1967-08-01 510. 198911 12.6 4.7 2945
3 1967-09-01 516. 199113 11.9 4.6 2958
# ℹ 571 more rowsWorking with the datasets that come with R and some packages is important, but this module will allow bringing datasets into R. Importing is a simple task but can have nuances requiring attention. You will learn to import csv (comma-separated values), csv2 (semicolon-separated values), .sav (SPSS), and .xlsx (Excel) files. Some tips on organizing data and variable names and exporting them in csv format will also be addressed. The packages readr (Wickham et al., 2024), haven (Wickham, Miller, et al., 2023), and readxl (Wickham & Bryan, 2023) will be used.
Handling codes for missing values
# A tibble: 6 × 5
  `ID do Aluno` `Nome Completo`  `Comida Favorita`  `Plano de Refeição`    Idade
          <dbl> <chr>            <chr>              <chr>                  <chr>
1             1 Sunil Huffmann   Iogurte de Morango Apenas Almoço          4
2             2 Barclay Lynn     Batata Frita       Apenas Almoço          5
3             3 Jayendra Lyne    <NA>               Café da Manhã e Almoço 7
4             4 Leon Rossini     Anchovas           Apenas Almoço          NA
5             5 Chidiegwu Dunkel Pizza              Café da Manhã e Almoço Cinco
6             6 Güvenç Attila    Sorvete            Apenas Almoço          6
Improving variable names
estudantes <- estudantes |>
  clean_names()

estudantes
# A tibble: 6 × 5
id_do_aluno nome_completo comida_favorita plano_de_refeicao idade
<dbl> <chr> <chr> <chr> <chr>
1 1 Sunil Huffmann Iogurte de Morango Apenas Almoço 4
2 2 Barclay Lynn Batata Frita Apenas Almoço 5
3 3 Jayendra Lyne <NA> Café da Manhã e Almoço 7
4 4 Leon Rossini Anchovas Apenas Almoço NA
5 5 Chidiegwu Dunkel Pizza Café da Manhã e Almoço Cinco
6 6 Güvenç Attila Sorvete Apenas Almoço 6 Graphs are an essential tool for data exploration and making result presentations more intelligible, avoiding solely relying on the dryness of tables. For this, an indispensable tool is the ggplot2 package (Wickham, 2016). This module will introduce some functions for creating simple graphs and others for controlling various elements of the desired figure.
Two numerical variables
ggplot(penguins,
       aes(flipper_length_mm,
           body_mass_g)) +
  geom_point() +
  geom_smooth(
    method = "lm"
    )
`geom_smooth()` using formula = 'y ~ x'Warning: Removed 2 rows containing non-finite outside the scale range
(`stat_smooth()`).Warning: Removed 2 rows containing missing values or values outside the scale range
(`geom_point()`).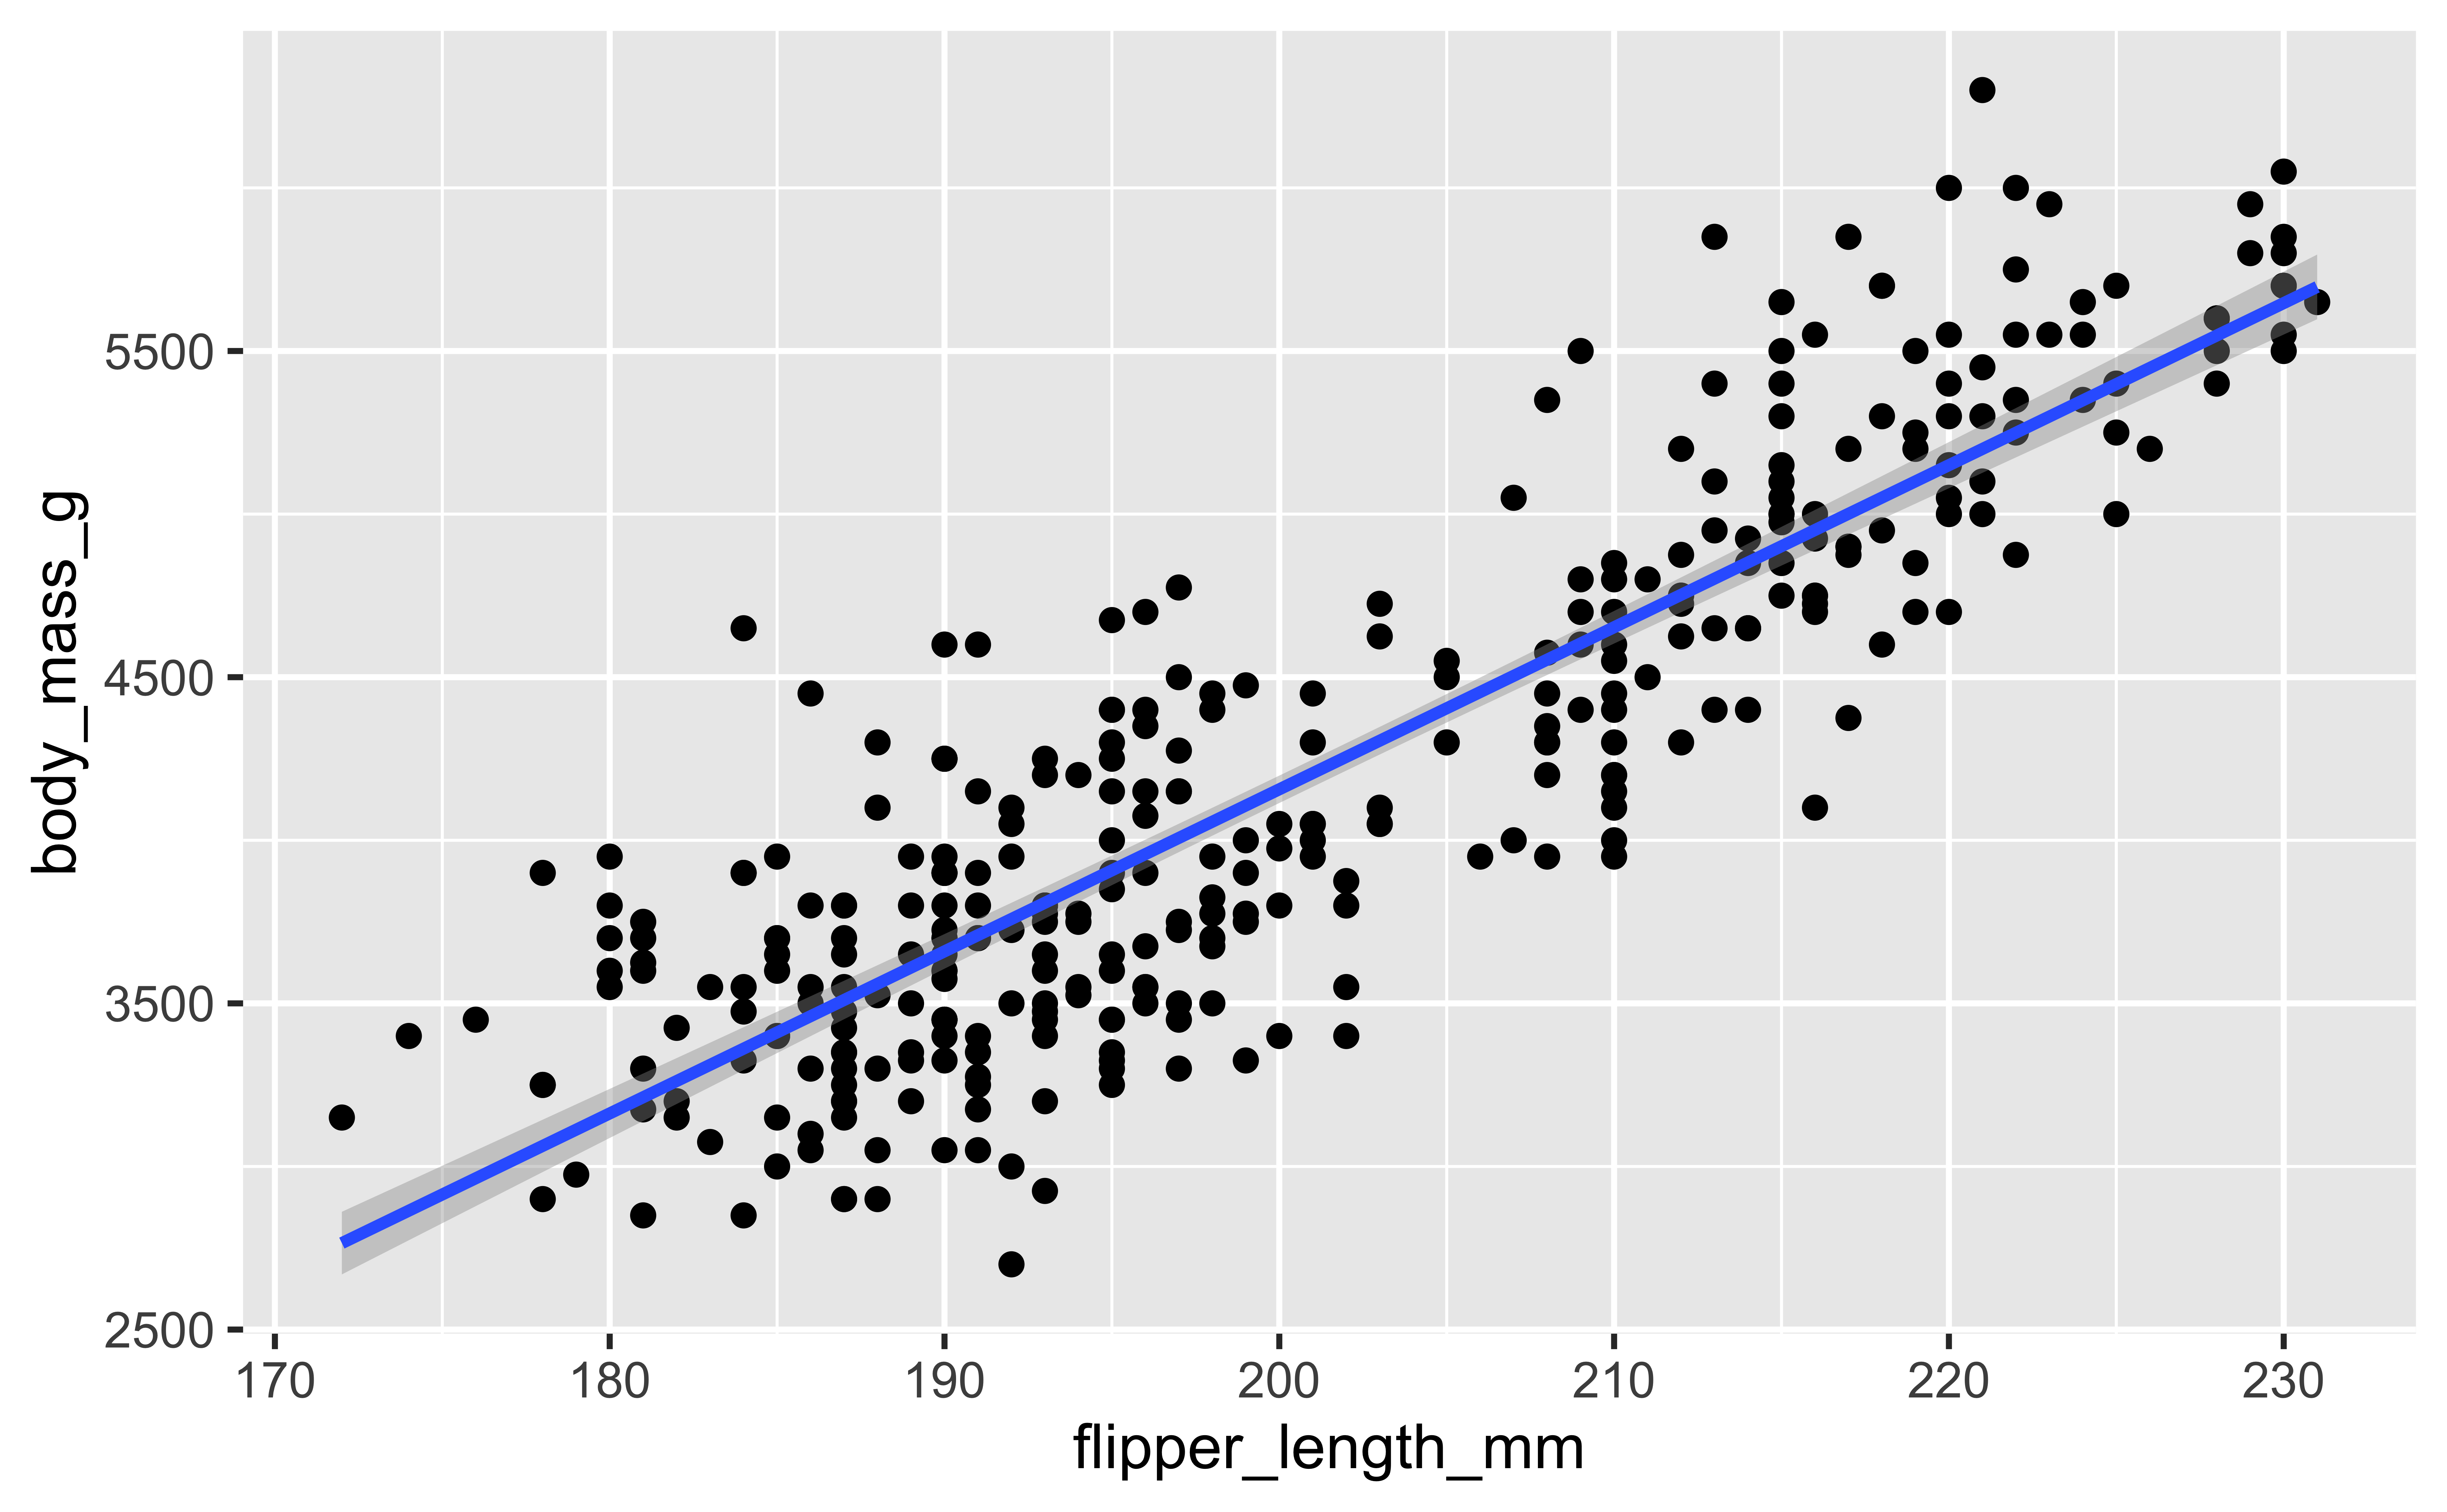
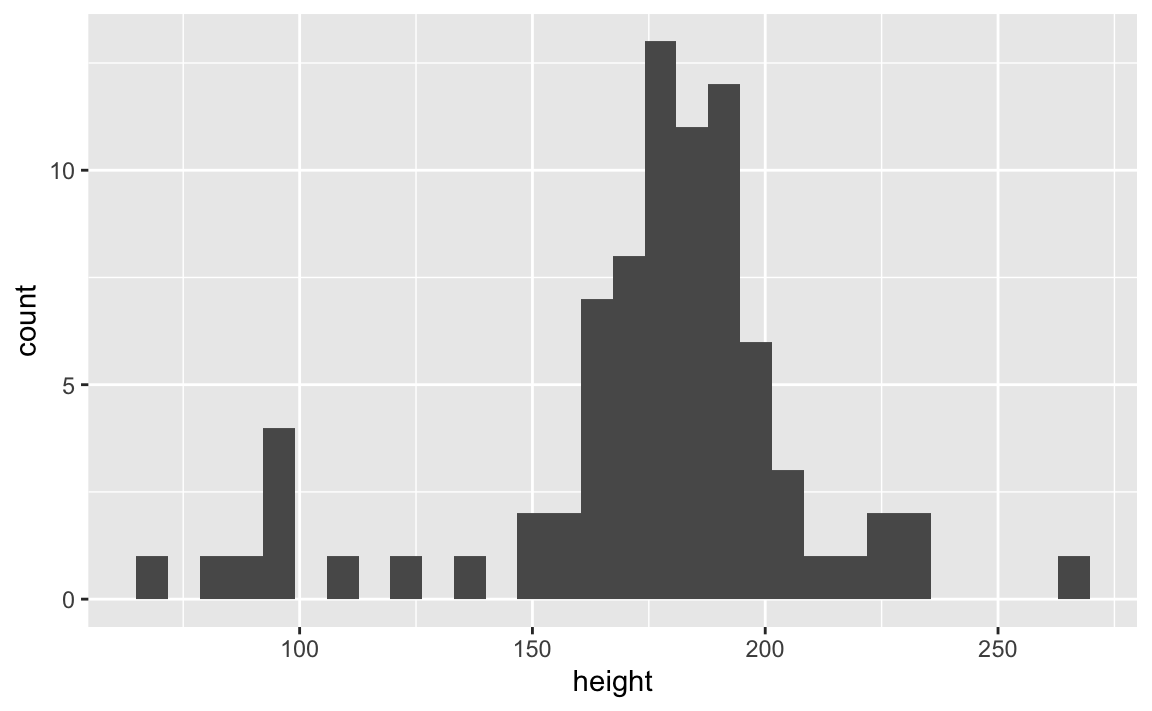
Exercise
Recreate the graph below using the starwars dataset.
This may be the module that most diverges from the routine of Psychology and Humanities researchers. Usually, data is collected, and when imported or entered into spreadsheets, it already has a tidy format. This format refers to: “Each variable is a column; each column is a variable. Each observation is a row; each row is an observation. Each value is a cell; each cell is a single value” (Ismay & Kim, 2022).
However, working with publicly available datasets or data not directly collected is not uncommon. Hence, it is essential to organize them for tidy data analysis. The pivot_longer() function will be explored for this purpose.
Rules for a tidy dataset
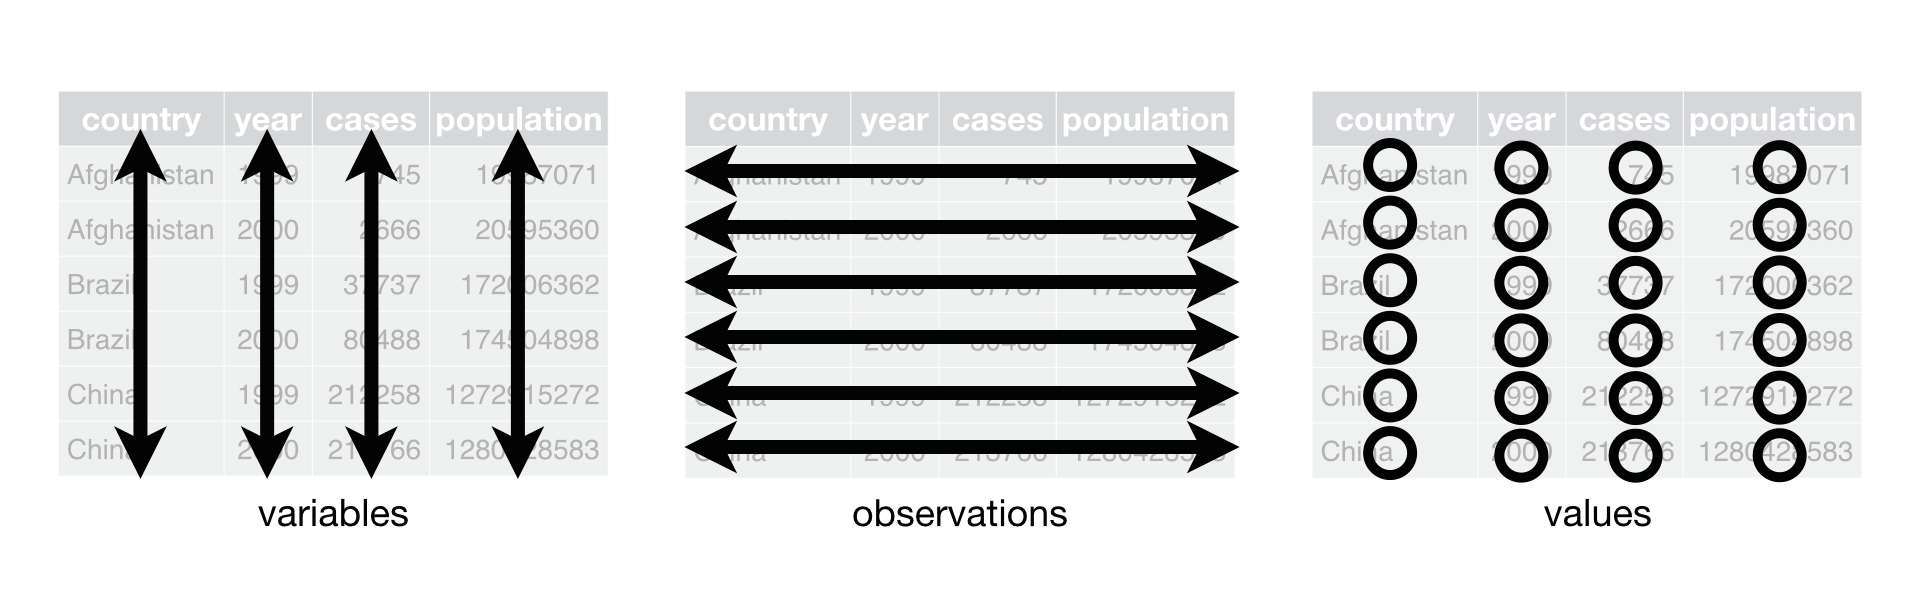
“The following three rules make a dataset tidy: variables are columns, observations are rows, and values are cells” (Wickham & Grolemund, 2023, section 5.2, Tidy data).
Linear regression is a simple statistical analysis but a fundamental tool for solving many problems researchers face daily. This module will cover basic concepts and their implementation in R. Besides the lm() function, part of R’s base, some tidymodels packages will be used. tidymodels is a set of tools and packages that provides a consistent and organized approach to statistical modeling and machine learning, following tidyverse principles of organization and clarity. It facilitates building, evaluating, and fine-tuning statistical models efficiently and intuitively.
Simple Linear Regression: One Categorical Independent Variable
Rows: 1000 Columns: 98
── Column specification ────────────────────────────────────────────────────────
Delimiter: ","
chr (12): genero, cor_raca, escolaridade, estado_civil, renda_pos_pandemia, ...
dbl (86): a1, a2, a3, a4, a5, a6, a7, d1, d2, d3, d4, d5, d6, d7, e1, e2, e3...

ℹ Use `spec()` to retrieve the full column specification for this data.
ℹ Specify the column types or set `show_col_types = FALSE` to quiet this message.Differences Between Means
t.test(tmcs ~ fct_relevel(grupo_de_risco, "Sim"), data = tmcs,var.equal = T)
    Two Sample t-test

data:  tmcs by fct_relevel(grupo_de_risco, "Sim")
t = 3.0395, df = 998, p-value = 0.002431
alternative hypothesis: true difference in means between group Sim and group Não is not equal to 0
95 percent confidence interval:
 0.3887405 1.8051091
sample estimates:
mean in group Sim mean in group Não
         5.630081          4.533156
fit_cat <- lm(tmcs ~ grupo_de_risco, data = tmcs) summary(fit_cat)
Call:
lm(formula = tmcs ~ grupo_de_risco, data = tmcs)

Residuals:
   Min     1Q Median     3Q    Max
-5.630 -4.533 -1.533  3.370 15.467

Coefficients:
                  Estimate Std. Error t value Pr(>|t|)
(Intercept)         4.5332     0.1790   25.33  < 2e-16 ***
grupo_de_riscoSim   1.0969     0.3609    3.04  0.00243 **
---
Signif. codes:  0 '***' 0.001 '**' 0.01 '*' 0.05 '.' 0.1 ' ' 1

Residual standard error: 4.915 on 998 degrees of freedom
Multiple R-squared:  0.009172,  Adjusted R-squared:  0.00818
F-statistic: 9.239 on 1 and 998 DF, p-value: 0.002431Finally, it is necessary to outline how the project will be executed, including MOOC availability and the registration period’s start. As mentioned earlier, the course was facilitated synchronously on Google Meet and recorded. It was a pilot application aimed at evaluating various aspects to improve its final version.
Thus, attention was given to slide quality, content presentation, interaction with exercises, and the impact of classes on the learning process. The participants’ involvement and evaluation throughout this process are crucial for the MOOC’s formulation, as there will be no direct contact with students in its full execution.
In this pilot application, the facilitator used slides to organize content presentation and performed coding alongside explanations. The slides also included exercises applying the introduced functions. Thus, explanations were interspersed with moments for participants to solve these exercises. Additionally, the website hosts exercise blocks corresponding to each course module, individually solved by participants, followed by a joint resolution meeting.
As the MOOC is still in the planning process, no specific registration period date has been set. However, it is expected to be completed by 2024.
This report aimed to detail the development process of the course “Introduction to R for data analysis in Psychology.” The relevance of the proposed theme was presented, along with the methodologies and strategies adopted in the MOOC’s construction. A self-assessment of the MOOC proposal will be presented, considering the following criteria: impact, coverage, potential reach (expansion possibility), replicability, complexity, demand, and innovation (technological advancement).
Regarding impact, the course is relevant as it serves as an entry point for researchers in Psychology and the Humanities who need to perform statistical analyses and transition from proprietary software to free, robust, and reliable tools like R.
The course’s utility lies in facilitating learning for people unfamiliar with programming languages by directing content to routine activities in the mentioned fields’ research. Similarly, the literate programming approach is relevant as it facilitates learning by bringing natural language closer to software language.
The course will have international reach as it will be available online, allowing access to Portuguese speakers. Potential reach refers to expansion and course update possibilities. Expansion can be achieved by creating new modules that extend introductory content and including others that present advanced R data analysis tools. Additionally, the modules need periodic updates, as the presented packages are constantly improved, which could render them obsolete if not kept up-to-date.
The course will have high replicability potential, as all produced content will be released under a CC BY-NC-SA 4.0 license (Attribution-NonCommercial-ShareAlike 4.0 International), allowing others to remix, adapt, and build upon the work for non-commercial purposes, provided proper credit is given, and new creations are licensed under identical terms (Creative Commons, 2023).
Moreover, the code used for the course’s construction was made publicly available on GitHub. Thus, R’s own use made the course reproducible and open, enabling others to review and expand it.
The course has high complexity as MOOC production required proper training and cognitive, technical, and social efforts. This was evident in the various stages necessary for the course’s construction: literature selection, content and material production, didactic proposal formulation to facilitate participant engagement, pilot application, and the technical knowledge of R, which required time and resources to acquire.
Regarding demand, the course addresses a gap in Psychology and Humanities researcher training. As previously mentioned, existing R proposals for data analysis are directed toward Statistics and Data Science, bringing content to a complexity level that does not meet the targeted fields’ needs.
Finally, the MOOC is considered highly innovative for Psychology, as there are no other courses on the subject in Brazil specifically addressing the area’s demands and being free. Additionally, replicability through open-source code and licenses as defined for the proposal is uncommon in the country.
Whenever there is a “Run Code” block, you can use it to type your code and then press the play button to execute it.↩︎